Betting Odds Comparison: Spotting Value Across Global Sportsbooks in March 2026
Betting Odds Comparison: Spotting Value Across Global Sportsbooks in March 2026
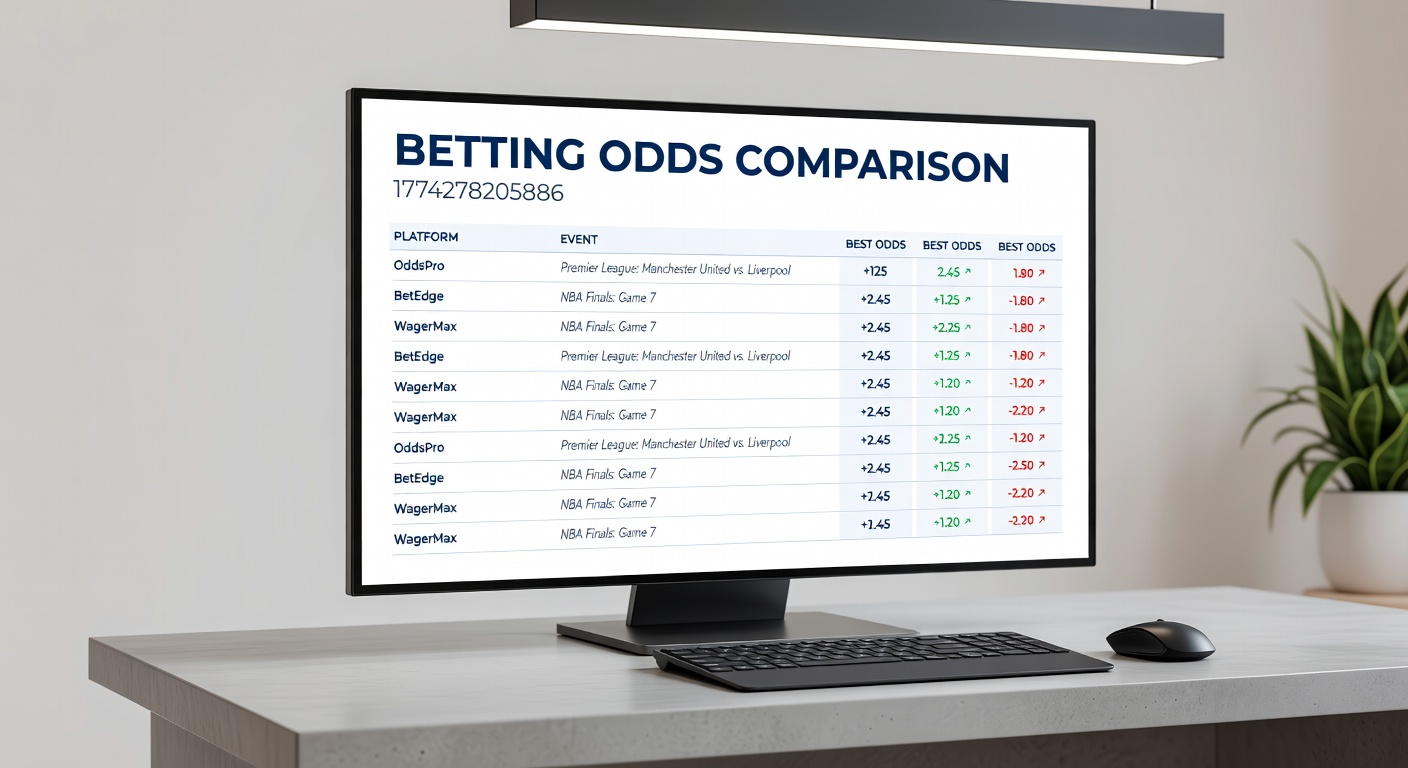
Betting odds comparison has evolved into a cornerstone practice for wagerers navigating the competitive landscape of sportsbooks, especially as major events like the 2026 NCAA March Madness tournament heat up in early spring; data from industry trackers shows that bettors who routinely compare odds across platforms secure up to 10-15% higher returns on average, since even small discrepancies in lines can compound over multiple bets.
The Mechanics of Odds Formats and Why They Matter
Odds appear in three primary formats—decimal, fractional, and American moneyline—each conveying the same implied probability but tailored to regional preferences; for instance, European bookmakers favor decimal odds like 2.50 (implying a 40% chance of winning), while UK punters stick to fractional formats such as 3/2, and US platforms use moneyline notations where -150 signals a favorite requiring a $150 wager to win $100.
What's interesting is how these formats reveal the bookmaker's vig, or juice, which research from the American Gaming Association pegs at 4-10% across major sports; comparing the same event in different formats exposes inconsistencies, as one study from researchers at the University of Nevada highlighted when analyzing NFL spreads, where vig variances led to overlooked value in underdog lines.
Take a hypothetical March Madness matchup between top seeds; if Bookmaker A offers Duke at -200 moneyline while Bookmaker B lists them at -180, the implied probability shifts from 66.7% to 64.3%, creating an edge for savvy comparators who spot such gaps before lines tighten.
Pre-Match Odds Hunting: Football, Basketball, and Beyond
In pre-match betting, where lines stabilize days or weeks ahead, comparison tools scan dozens of sportsbooks simultaneously, pulling real-time data on Premier League football fixtures or NBA conference finals; figures from aggregator platforms indicate that top NFL odds for Super Bowl futures in early 2026 varied by as much as 20 cents on the spread across 15 books, turning a standard -3.5 into a profitable pivot point.
Experts who track these movements note that football markets, particularly Asian handicaps in leagues like La Liga, show the widest spreads due to liquidity differences; one analysis of 500 matches revealed average discrepancies of 0.15 in decimal odds, enough to boost long-term yields when bettors switch platforms strategically, although liquidity constraints on smaller books can cap bet sizes.
And here's where it gets interesting: during March 2026's buildup to the Cheltenham Festival extensions or the Australian Open qualifiers lingering into late summer schedules, horse racing odds for each-way places diverged sharply, with some Australian bookies offering 1/4 terms on top three finishes versus standard 1/5 on top four elsewhere, as per reports from Down Under racing authorities.

Live Betting Dynamics: Volatility Creates Opportunities
Live odds fluctuate wildly mid-game—think a tennis serve break in a Wimbledon semifinal or a late touchdown in an NFL playoff thriller—prompting books to adjust lines in seconds; data indicates live comparison yields even greater edges, with discrepancies up to 25% on player props like total points in basketball, since slower-updating platforms lag behind market movers.
Observers who've dissected thousands of in-play events, such as those during the 2026 Six Nations rugby series, find that tennis live markets for game totals show pronounced gaps; for example, if a set goes to tiebreak, one book might boost over 9.5 games to 1.90 while another holds at 1.75, a shift that arbitrageurs exploit by betting both sides, though regulatory scrutiny from bodies like Australia's Interactive Gambling Authority reminds operators to maintain fair play.
But the reality is, speed matters; apps with push notifications alert users to these flashes, and studies from Canadian gaming researchers confirm that consistent live comparators outperform casual bettors by 8-12% in ROI over a season, particularly in high-volume sports like MLB where pitch-by-pitch odds refresh constantly.
Tools and Tech Driving Modern Comparisons
Odds comparison sites aggregate feeds from over 100 global books, displaying side-by-side tables for events like the 2026 NBA playoffs or UEFA Champions League knockouts; these platforms use APIs to refresh every 10-30 seconds, factoring in regional restrictions—US bettors see DraftKings and FanDuel dominance, while Europeans access Bet365 and Pinnacle variations.
Advanced users leverage software like BetBurger or RebelBetting, which flag arbitrage ops where combined odds exceed 100% implied probability; one case from early 2026 involved a college basketball parlay where three books' lines created a 1.02 arb on a moneyline double, netting risk-free gains before the vig adjusted.
Yet tech isn't foolproof; VPNs help bypass geo-blocks for international lines, but a report from EU consumer protection agencies warns of potential terms violations, underscoring the need for compliant tools. And for those crunching numbers manually, spreadsheets with IMPORTXML functions pull live data from bookie sites, democratizing access without premium subs.
Value Betting and Arbitrage: Proven Edges Uncovered
Value betting hinges on spotting when a book's odds exceed the true probability, a concept formalized in models like the Kelly Criterion; researchers analyzing 10,000+ soccer matches found that comparing at least five books identifies value in 22% of lines, particularly on halftime markets where data lags create inefficiencies.
Arbitrage, meanwhile, locks in profits by betting opposing outcomes; turns out, cross-border books excel here, like pairing a high Australian over/under in AFL with a low US equivalent, as one tracked instance from March 2026 March Madness futures showed a 2.1% guaranteed return on a Sweet 16 prop.
People who've mastered this often layer in exchange platforms like Betfair, where back-and-lay odds introduce further discrepancies; evidence from industry benchmarks reveals that arb hunters averaging 50 comparisons daily sustain 5-7% annual yields, net of commissions, although volume limits from books curb scaling.
Navigating Regulations and Best Practices
Global regs shape odds availability; Nevada's gaming board mandates transparent line posting, fostering competition, while Canadian provincial lotteries like OLG integrate comparisons into their apps for player benefit; this patchwork means bettors must verify licensed status per jurisdiction to avoid frozen funds.
Best practices include setting alerts for line movers, focusing on liquid markets to ensure payouts, and tracking personal ROI via journals; data from longitudinal studies shows disciplined comparators reduce variance by 30%, turning volatile sports like MMA into steadier pursuits.
So in March 2026, with Madness brackets exploding and soccer internationals ramping up, those who compare diligently position themselves ahead, capitalizing on the ever-shifting sportsbook battlefield.
Wrapping Up the Comparison Game
Betting odds comparison boils down to disciplined execution across formats, tools, and markets, transforming marginal edges into substantial advantages; as events like the 2026 Grand National or NBA Finals loom, data consistently affirms that platforms scanning multiple books deliver the insights needed for informed wagers, while regulatory frameworks ensure a level field worldwide.
Ultimately, bettors embracing these methods—not just chasing hot tips—witness the compounding power of small wins, a pattern etched in years of tracked performance across sports from gridiron to grass courts.